
Jun 11, 2026•5 min read
Haryana GCC Policy 2026: What the Incentives Mean for GCC Location Decisions in NCR
Read More
Written by: Aaradhna
Published at: 04/28/26
Singapore holds roughly 49 million sq ft of office stock across a land area of 730 sq km, and it is running out of room to add more. For decision-makers tracking the Singapore office market 2026, that physical constraint is the starting point for understanding everything else: why vacancy stays low, why rents hold firm, and why leasing here operates on fundamentally different terms than most other markets in Asia. This blog covers the key dynamics shaping Singapore's office market this year, including submarket structure, leasing activity, vacancy, rents, demand, and upcoming supply, and what each of them means for occupiers planning a move or expansion.
Singapore's commercial real estate market is one of Asia's most stable, transparent, and strategically positioned destinations. It continues to be home to global banks, technology firms, and multinational headquarters.
At just ~730 sq km, the country has no hinterland to expand into. Unlike large economies where demand spills into secondary cities, Singapore operates as a single, tightly managed urban system.
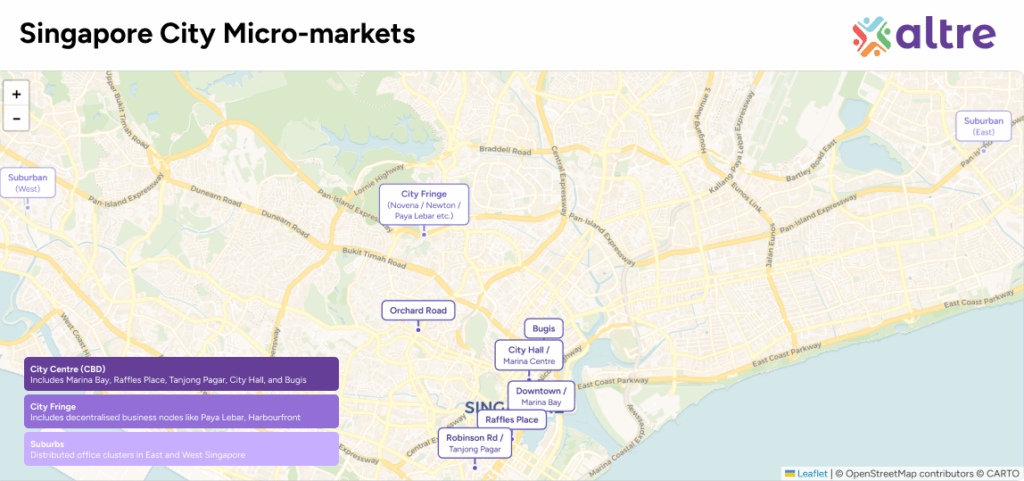
The city is structured around a highly concentrated City Centre, anchored by the Central Business District (CBD), and supported by secondary decentralized hubs in the city fringe and suburban regions. The Urban Redevelopment Authority regulates the supply, land use, density, and development cycles.
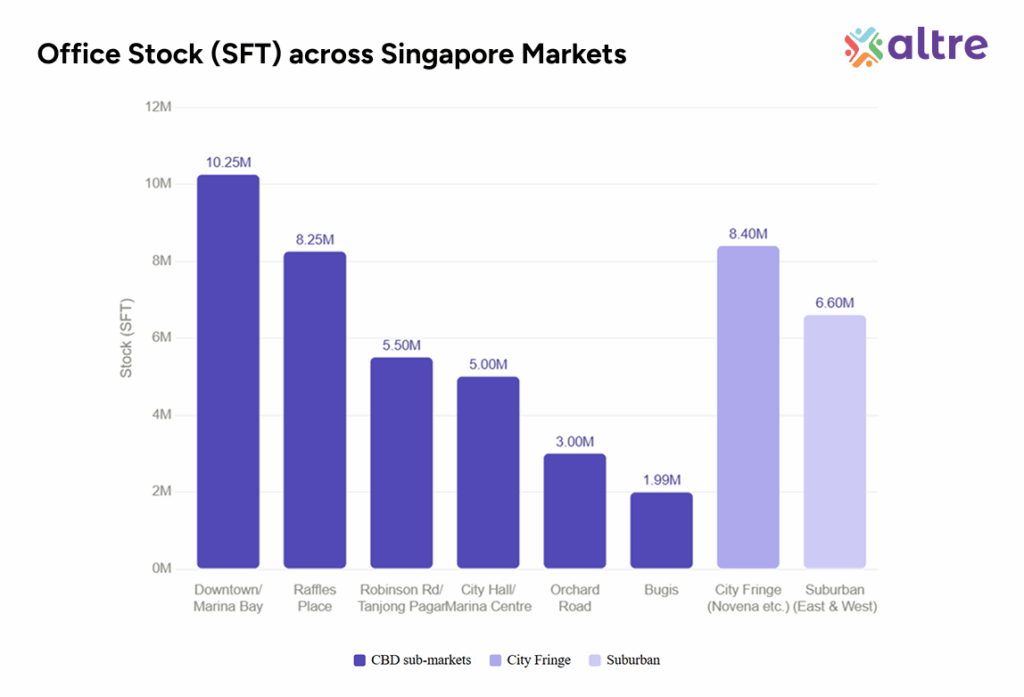
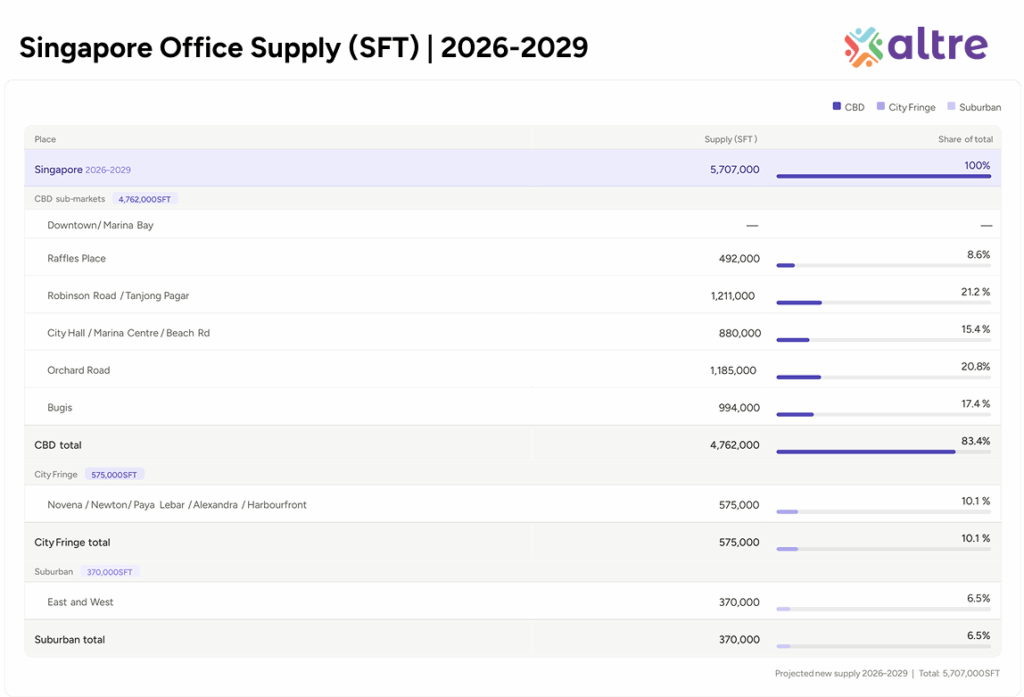
Total office stock stands at ~49 million sq ft, with an upcoming supply pipeline of ~5.7 million sq ft (2026–2029), a relatively modest addition given the scale of demand. It is distributed around the city as such:
Core Market Structure
Within this, the CBD itself fragments into high-performing micro-markets, including Marina Bay, Raffles Place, City Hall, and Bugis, each with distinct positioning. This clustering creates micro-market differentiation within a small geography, allowing tenants to choose between legacy prestige (Raffles Place), modern infrastructure (Marina Bay), or value positioning (city fringe).
What is striking is how close and interconnected these micro-markets are. In most global cities, such clusters would be spread across several kilometres; in Singapore, they operate almost as a single integrated district. This creates a level of density and efficiency that few markets can replicate.
The city-state has a tiered but compact market, where the City Centre dominates not just in scale, but in pricing power, tenant quality, and global relevance.
Singapore's office leasing activity in 2025 stood at ~0.9 million sq ft of net absorption, a relatively modest figure when viewed in isolation, but one that accurately reflects the nature of this market. Unlike expansion-driven markets, leasing in Singapore is largely driven by relocations and upgrades rather than new demand creation. Most activity was concentrated in prime Singapore CBD office micro-markets such as Marina Bay, Raffles Place, and City Hall, where occupiers moved into newer Grade A office Singapore developments, reinforcing the ongoing flight to quality, the trend of tenants actively seeking better-specified, more efficient, and more prestigious buildings over simply expanding their footprint. This explains why even with limited absorption volumes, vacancy remains low and rents continue to hold firm.
For perspective, India recorded ~79 million sq ft of absorption in 2025, but that scale is driven by expansion across multiple cities. Singapore's leasing numbers reflect a mature, efficiency-led market where demand is stable, selective, and highly quality-focused.
One of the most defining features of office vacancy Singapore tracks is its consistently low level. At an island-wide level, vacancy sits at around 5%, dropping further to ~3% in the City Centre, and even lower, close to 2% in prime micro-markets like City Hall. These are not cyclical numbers; they reflect a structural condition.
The geographic pattern of vacancy is telling. Higher vacancy figures were concentrated in supply-heavy areas like Tanjong Pagar (9%) and parts of the City Fringe (7%), while core sub-markets like Marina Bay, Raffles Place, and City Hall remained near full occupancy. Tanjong Pagar's elevated vacancy is partly a function of its ongoing supply pipeline, with 8 Shenton Way (949,000 sq ft) and 80 Anson Road (262,000 sq ft) both completing in Q3 2028, making it the one sub-market where landlords will need to work for tenants rather than the other way around.
This localized nature of vacancy allows the broader market to remain stable, even as individual sub-markets adjust. It also ensures that prime assets continue to outperform, reinforcing the hierarchy within the CBD.
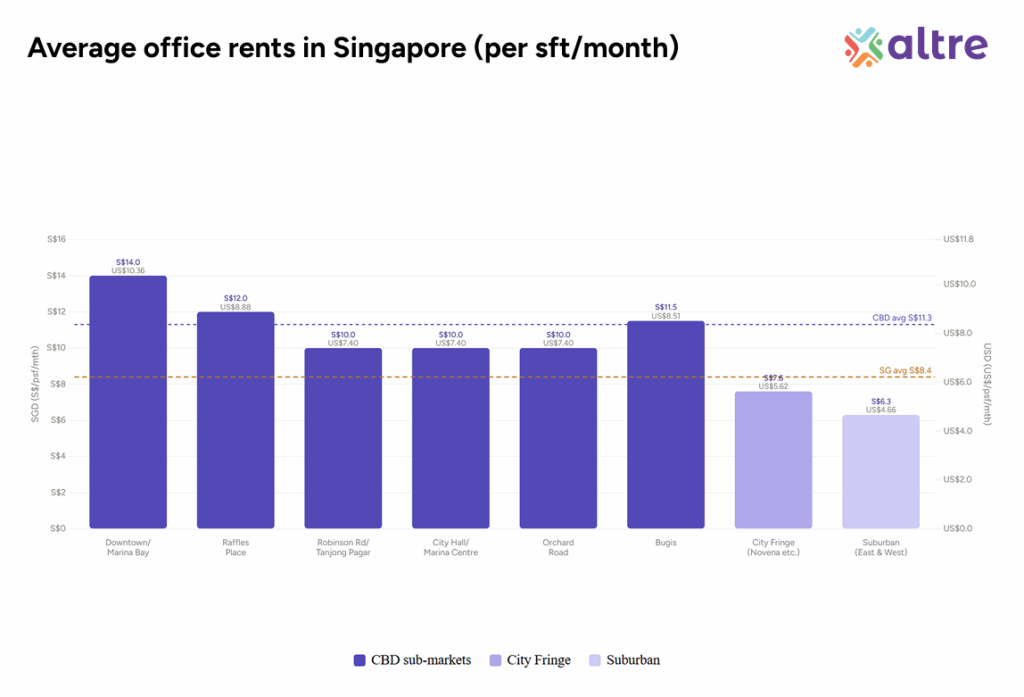
Singapore office rents are among the highest globally, with averages at approximately S$8.9 per sq ft per month (USD 6.6 / INR 601), and significantly higher levels in prime CBD assets at S$11.3 per sq ft per month (USD 8.9 / INR 807) in 2025.
What is important here is not just the level of rent, but the trajectory. Rental growth in Singapore is typically gradual at around ~2% year-on-year, but it is consistently upward over the long term, reflecting a market that prioritizes sustained performance over spikes.
A brief comparison helps put this into perspective. As detailed in Altre's India vs World Global Office Comparison Report, average office rents in India are around INR 107 per sq ft per month, with premium micro-markets reaching higher levels. Singapore's average already sits well above this, even before considering its prime assets.
The difference stems from three structural factors:
Together, these ensure that Singapore remains a landlord-driven market, where pricing power is rarely diluted.
The nature of demand in Singapore is as important as its volume.
The market is anchored by financial services firms, technology companies, and multinational corporations, many of which use Singapore as their Asia-Pacific headquarters. For GCCs and multinationals evaluating their regional footprint, Singapore's role as a decision-making centre rather than an operational one shapes both where they locate and what they are willing to pay. Unlike markets where office space is primarily used for large-scale operational functions, Singapore's offices typically house leadership, strategy, and high-value functions.
In 2025, most large transactions were concentrated in premium CBD assets, particularly in Marina Bay. Companies were not necessarily expanding aggressively; instead, they were relocating into higher-quality buildings, consolidating operations, or upgrading their presence.
This flight to quality is expected to continue into 2026. As new developments come online, tenants are likely to gravitate toward:
The result is a market where new supply does not dilute demand, but rather reshapes it toward better assets.
Supply: Measured, Phased, and Strategic
Unlike many global markets where supply is reactive, Singapore's supply pipeline is planned and phased. Upcoming developments are concentrated in key micro-markets:
| Submarket | Building | Completion | Area (sq ft) |
| Raffles Place | Clifford Centre | Q2 2028 | 492,000 |
| Robinson Road / Tanjong Pagar | 8 Shenton Way | Q3 2028 | 949,000 |
| Robinson Road / Tanjong Pagar | 80 Anson Road | Q3 2028 | 262,000 |
| City Hall / Marina Centre / Beach Road | Shaw Tower | Q2 2026 | 480,000 |
| City Hall / Marina Centre / Beach Road | Golden Mile | Q1 2029 | 400,000 |
| Orchard Road | 31 Exeter Road | Q2 2028 | TBC |
What is notable is not just where the supply is coming from, but how it is introduced. Projects are timed and distributed in a way that avoids oversupply. Even in periods of increased development activity, the market rarely sees a sharp spike in vacancy. Instead, new buildings often trigger relocation-led demand, as occupiers move from older stock into newer, more efficient spaces.
This creates a self-correcting cycle where new supply attracts tenants, older buildings reposition or upgrade, and overall vacancy remains stable.
Perhaps the most important takeaway about Singapore is that it is not designed for rapid expansion or dramatic growth cycles. Instead, it operates on a principle of equilibrium: supply is carefully controlled, demand is high-quality and consistent, vacancy remains low, and rents grow steadily.
This makes Singapore fundamentally different from high-growth markets. It does not offer explosive upside, but it provides predictability, resilience, and long-term value.
For real estate heads and CFOs making decisions in 2026, Singapore's market structure has direct practical implications.
Negotiating leverage is limited in prime submarkets. With vacancy at 2–3% in City Hall and Marina Bay, landlords have little incentive to offer significant concessions on rent, fit-out contributions, or lease flexibility. Occupiers who need Grade A space in these locations should plan for longer lead times and realistic expectations on deal terms.
Tanjong Pagar is the exception. With two large completions arriving in Q3 2028 and vacancy already at 9%, this submarket offers more room for negotiation than the CBD average suggests. Occupiers with flexibility on location may find better terms here over the next 18–24 months.
The flight to quality is a real cost driver. As tenants across the market upgrade into newer stock, older buildings are being repriced or repositioned. Occupiers who anchor to legacy rental benchmarks from older buildings may find that comparable space in newer developments commands a meaningful premium, and that older buildings offering apparent value come with trade-offs in specification, efficiency, or ESG compliance.
Cost comparison with India remains stark. Even at the value end of Singapore's market, occupiers are looking at per-square-foot costs three to four times higher than equivalent Grade A space in Bengaluru or Hyderabad. For organizations evaluating both markets, the decision is not purely about cost, but the quantum difference is significant enough to shape headcount and function decisions.
Singapore's office market in 2026 is a study in controlled equilibrium. Low vacancy, steady rental growth, and a disciplined supply pipeline combine to create one of the most landlord-favourable markets in Asia, and one of the most expensive. For occupiers, the strategic implication is clear: the window to secure quality space on favourable terms is narrow, and preparation needs to start earlier than in more liquid markets. For organizations benchmarking Singapore against other Asia-Pacific locations, Altre's India vs World Global Office Comparison Report provides a detailed cross-market view. To discuss your specific real estate requirements, speak with Altre's advisory team.
Published: April 28, 2026
Discover more insights and expert perspectives on commercial real estate and business growth

Copyright © 2026. All rights reserved.